A simple guide to indian share market beginners and basic information about share markets and mutual funds.
Sunday, October 14, 2007
How US Markets Affect Indian Stock Market
It is lending to people who are less capable of repaying (More credit risk; Less credit worthiness).
In US some institutions has lend loans like this to such people(less capability to repay). Since they are high risk loans interest rate will be high. These institutions also adopt a process called securitization (conversion of these loans into tradeable securities).
In simple terms the institutions says that i will earn repayment every month from these borrowers and institutions will trade this loan as bonds and investors will invest in it. As most of the housing loans were traded like this in us these borrowers didn't pay back.
So it led to non-performing assets in banks balance sheet. So investors in these bonds started selling their bonds which pull down the us stock market. Everyone wanted to take their money in these bonds as loans are not repaid.
It had an impact on Indian stock market as well some people who lost their money also wanted to compensate their loss by selling shares they holded in Indian companies, this pulled back Indian stock market also for a while.
Note: stock market will come down when sellers are more (bearish). It will go up when buyers are more (bullish)
What did US GOVERNMENT DO to minimize this risk? They cut down the interest rates so that people will borrow at lesser rate and invest. But this helped Indian market also because they borrowed in us at lesser rate and invested in Indian market which is bullish now.thats is why our market adjusted very quickly.
Rupee appreciation
It means i am able to but dollar at a cheaper rate.
That is for a particular amount of rupee I can buy more dollars.
When it happens. When we have sufficient amount of dollars in hand we don't need more. When US depends on Indian goods they have to pay in rupees and they exchange their dollars for rupees with RBI and hence we have more dollars. When investments from US come into India also this exchange takes place and hence we have more dollars and rupee appreciates.
Right now because of last reason our rupee has appreciated.
When rupee appreciated it is bad for exporters because say for every one dollar product they sell in US they will get less rupees.It is good for importers because for a particular amount of rupee in hand they can get more 1 dollar products and sell in India.
But some domestic manufacturers who manufacture and sell in India will get affected by substitute import products because they become cheaper.
What RBI has done to curb appreciation is open up investment opportunities for Indians in US. That means they allow them to invest more in us there by more dollars will be demanded by them to invest and dollar demand will raise and rupee appreciation will come down.
But critics also comment on these that when US market is not good who will invest outside and hence this didn't have much impact on curbing the appreciation.
PRABHU.S
KIAMS
Sunday, July 08, 2007
What Are Options?
Saturday, July 07, 2007
Futures and Options - What it means ?
Tuesday, July 03, 2007
RELIANCE PETROLEUM VALUATION
- Demand could outstrip refining capacities and existing refineries unable to process so-called dirty crude may have to be shut down
- Heavy (dirty crude) is cheaper than light crude around 5 dollars/barrel and RPL can capitalize on it.
- This leads to gross refining margin go up with the ability to produce superior products from cheaper crude.
- Some of the other refineries that plan to expand also will complete their project only on 2011.
- RPL will be one of the 5% with the ability to process heavier crude in the world.
- But the capital cost for high-tech refining set up is higher than the older method by 4 dollars/barrel/day.
- But RPL has managed itself to set up in SEZ, which has tax-redemption on exports 100% for 5 years and later 50% for next 5 years.
- Duty-free import of crude oil and capital equipment because of SEZ.
- Technology, knowledge, marketing expertise of RIL can be shared with RPL and hence synergy between both.
Monday, April 16, 2007
Basics Of Technical Analysis in Share Markets
Share market experts rely on two analysis before selecting a share for investment. One is technical analysis, in which a share's movement of price and volume is studied over years and they try to strategize the movement. Another is the fundamental analysis in which they study about the company associated with that share, its sector growth etc.
However a genuine investor cares more about fundamental analysis of a company because the price of a share can be manipulated to go up or down. if this there on one side ,as I already said nowadays information about company and sector performance reaches all at the same time through media ,fundamental analysis also became a more common feature known to all experts.
So sometimes, a common man who is a regular observer of market is able to set good portfolio for himself when compared with experts. In this article I will just take you through certain basics of technical analysis.
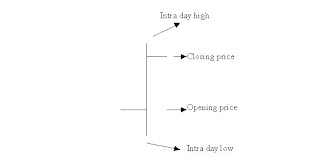
Candlestick representation of a stock price movement within a day:

A share when traded will be subjected to four price levels:
- Opening Price: The price at which the first trade is done or the market opens
- Closing Price: The price at which last trade is done or When the market closes.
- Intra-Day High: The maximum price the share was traded for the day.
- Intra-Day Low: The minimum price the share was traded for the day.

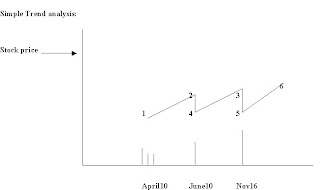
This is simple ideal graph by which I am trying to explain you all the simplest way of predicting and investing. The share price is plotted for various days in a graph as shown above. Using statistical tools the trend line is derived. It will be observed that prices follow a particular pattern. Assume that you are close to level 4 of the graph. Since you know the price is going to rise after that you can buy the stock. The bottom vertical projections from x –axis indicate the volume of trade, usually at these points volume will be more because of buying. Similarly it is the reverse when you are point 3.this is the simplest way of understanding and in further articles I will take you to depth.
Prabhu.s
KIAMS
Saturday, February 10, 2007
What are Mutual Funds?
She will say "If you lose one amount by mistake or someone poaches it, the other will help you. Instead, if you keep all in one purse and if you lose the purse you lost the way."
It was this concept in operations called as buffer, in engineering called as "Safety Factor" and in finance "The Balanced Portfolio".
This is the underlying principle of mutual funds where instead of investing in one stock, they invest in a portfolio of stocks thereby they can minimize one's risk and obtain optimum returns.
Let me try to explain this with two simple stocks for example. Let us consider one stock whose share value increases when index (assume sensex) increases and another stock whose share value decreases as sensex increases. The first one is called as "Positive Correlation" and the second one is called as "Negative Correlation". The value which we use to measure how much the stock price increases with respect to sensex is called as "Beta". It is nothing but the slope of the curve drawn in a graph where we take "sensex" (index) value in x-axis over a period of time and stock price in y-axis. So the first stock will have a positive beta value and the second one a negative beta value.
Now assume if you invest in only first stock assuming that sensex will move up and if it goes down you are going to lose a lot. Similarly if you invest in second stock thinking that sensex will go down and if it increases you will once again lose. Incase, if you invest in both the stocks (in proportion to how much their price vary according to the sensex index) you may not get maximum return but whatever be the sensex(index) movement bullish(upward) or bearish(downward) you will get optimum return. This is how mutual funds choose their stocks in their portfolio and maximize their returns and minimizes their risk.
But choosing stocks is not that easy as we mentioned. Many things in life are written but done with sweat. This is not an exemption for that. Based on this principle, some funds choose stock pertaining to only one sector called "sector funds". Some in proportionate amount listed in all sectors in an index called "index funds" and so on.
This is simple thing we can also do as an investor by tracking the stock price. Instead of investing one stock, pick two or three by logics (or use tools if you can) and we can minimize risk.
And hope a few who benefit out of this will always be thankful to my great investment guru "my grandmother"
Prabhu.S
KIAMS